Lead funnel metrics
Total, new, qualified, and converted lead counts with the conversion rate for the selected range.
CRM Feature
Pick a date range and see your lead funnel, pipeline value, won revenue, win rate, overdue tasks, and today’s activities — each metric compared against the previous period, with recent activity and priority work listed alongside.
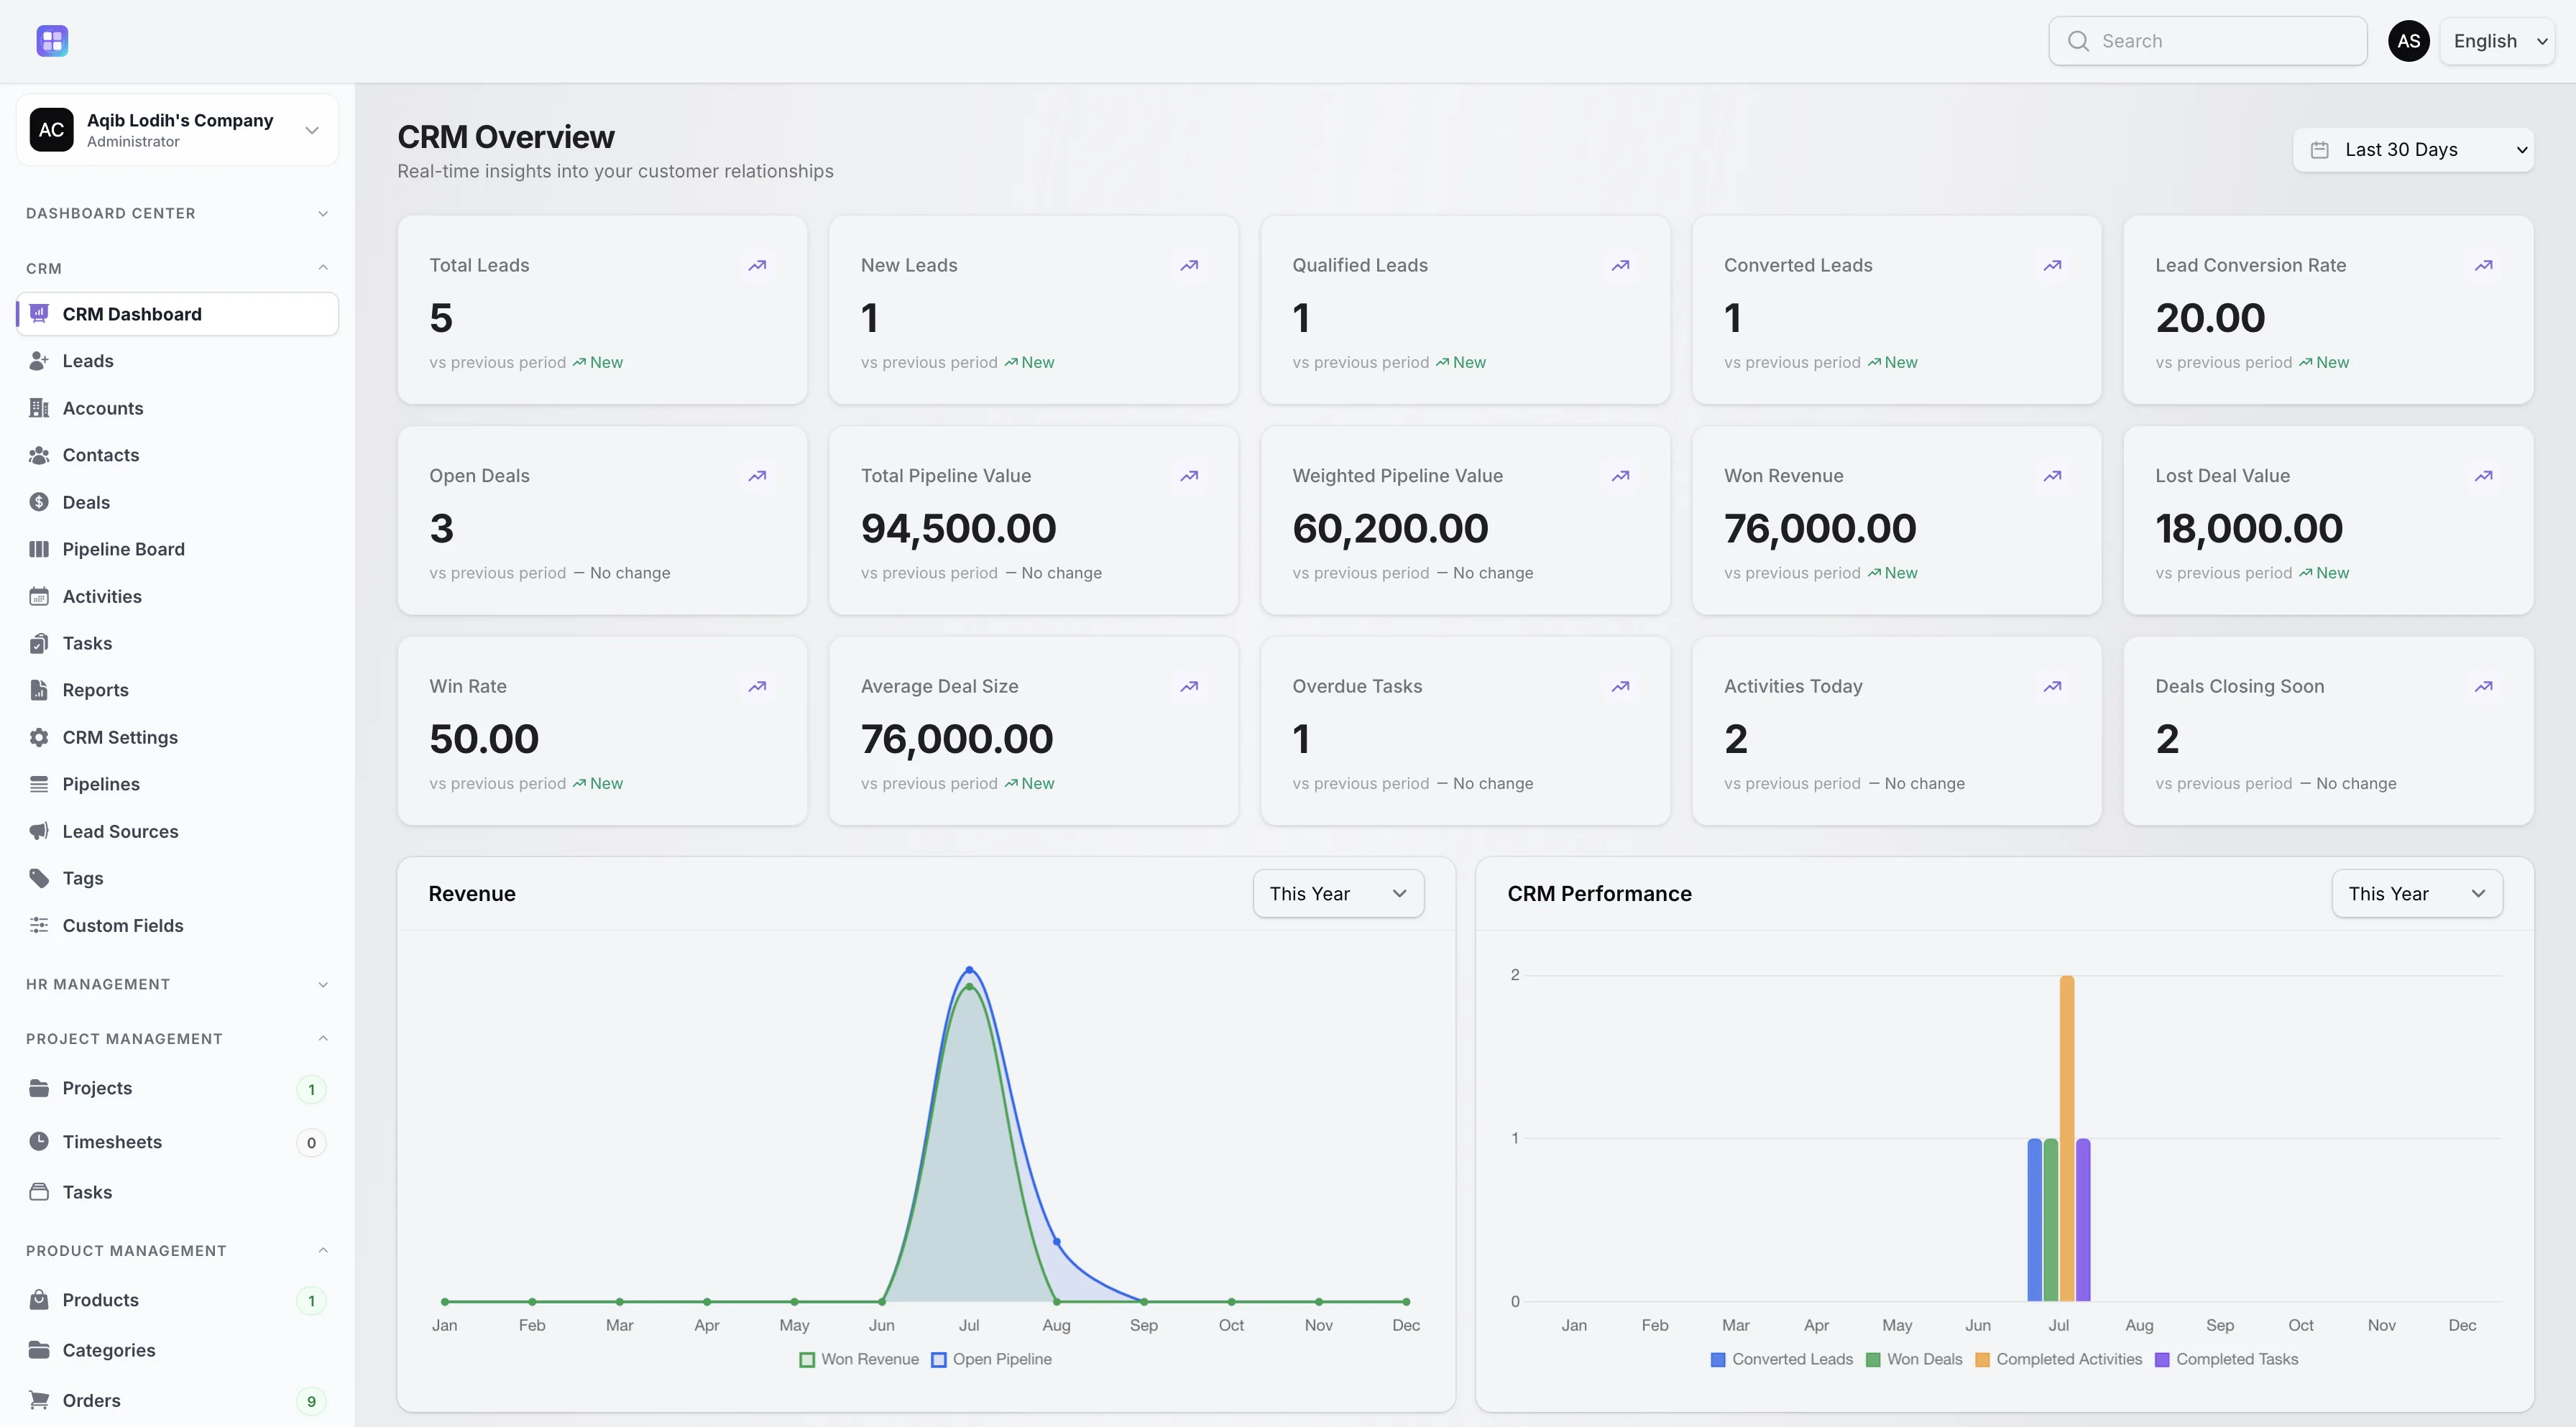
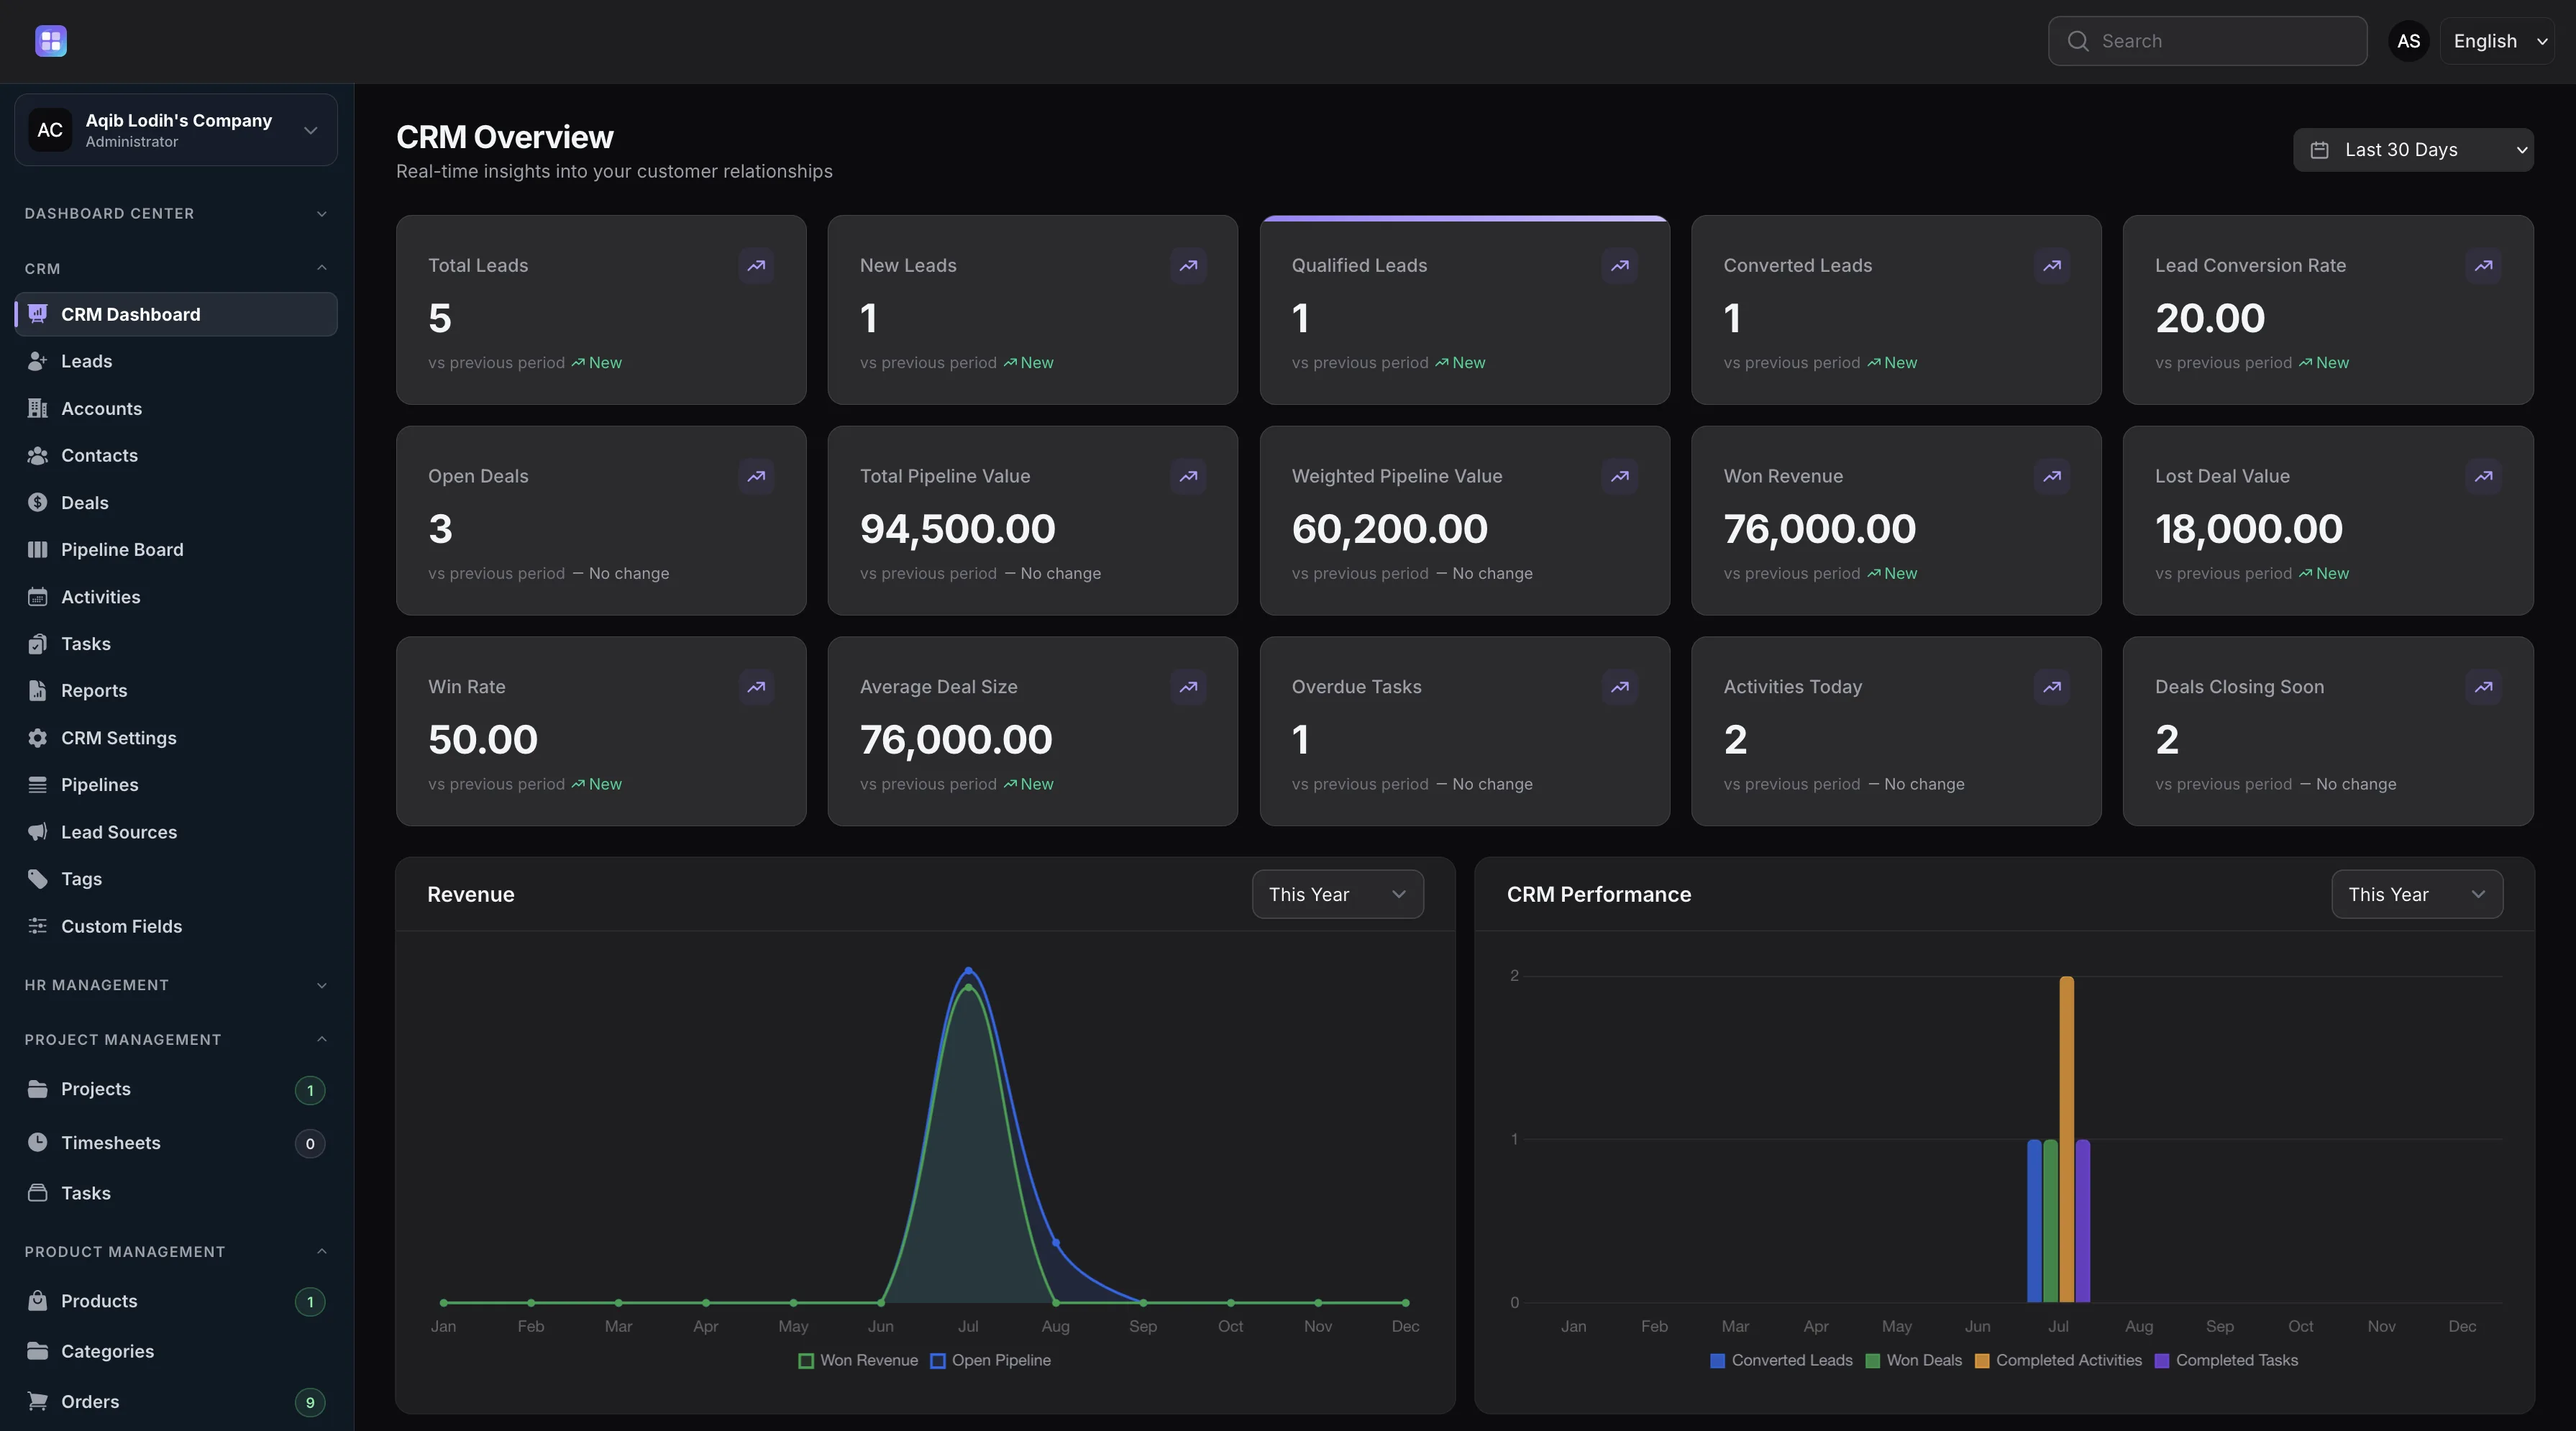
Metric cards, trend indicators, charts, recent activities, and priority tasks from the actual CRM dashboard.
Overview
The CRM dashboard computes fifteen metrics from your real records for a selected range — today, the last 7 days, this month, last month, this year, or the last 30 days. Lead metrics cover totals, new, qualified, and converted leads plus conversion rate; deal metrics cover open deals, total and probability-weighted pipeline value, won revenue, lost deal value, win rate, average deal size, and deals closing within 14 days; work metrics count overdue tasks and activities scheduled today.
Every metric is compared against the previous equivalent period and marked as trending up, down, or flat with a percentage. Below the metrics, the dashboard lists the five most recent activities and the five highest-priority open tasks, and renders customer growth and customer status charts. Results are cached briefly and refreshed automatically when CRM events change the underlying data.
Capabilities
Every capability below reflects functionality implemented in the TenantSaaS CRM module.
Total, new, qualified, and converted lead counts with the conversion rate for the selected range.
Open deals, total pipeline value, weighted pipeline value, won revenue, lost deal value, win rate, and average deal size.
Each metric compares against the previous equivalent period and shows an up, down, or flat trend with a percentage.
Overdue task counts, activities scheduled today, and deals closing within the next 14 days.
The five latest activities and the five most urgent open tasks, ordered with overdue work first.
Customer growth and customer status chart widgets render below the metric cards.
Record Management
How It Works
This flow follows the statuses, actions, and events implemented in the CRM module.
Choose the reporting window; the default view covers the last 30 days.
Lead totals and conversion rate show how top-of-funnel work is progressing versus the previous period.
Open deal counts, pipeline value, and weighted value reveal how much revenue is in motion.
Overdue tasks, today’s activities, and deals closing within 14 days show where attention is needed now.
Recent activities and priority tasks point straight at the records that need work next.
Access Control
Dashboard access is permission-gated per role, and the page checks the workspace’s CRM availability before rendering.
FAQ
Answers reflect the CRM implementation that ships with TenantSaaS.
Fifteen metrics: total, new, qualified, and converted leads; lead conversion rate; open deals; total and weighted pipeline value; won revenue; lost deal value; win rate; average deal size; overdue tasks; activities today; and deals closing within 14 days.
Yes. The dashboard offers today, last 7 days, this month, last month, this year, and last 30 days.
Each metric is compared against the previous equivalent period and labeled up, down, or flat with a percentage change.
Metrics are cached for ten minutes, and the cache is cleared automatically when leads convert, deals change stage or close, and tasks or activities complete.
Customer growth and customer status charts render below the metric cards.
Yes. It lists the five most recent activities and the five highest-priority open tasks, with overdue work ordered first.
Start a free TenantSaaS workspace and manage dashboard alongside the rest of the CRM module.